There are endless rankings of the US states: whether they are the best places to live, the best places to do business, how much fun they are. Such judgements are made by economists, companies, and journalists – but what do Americans themselves think?
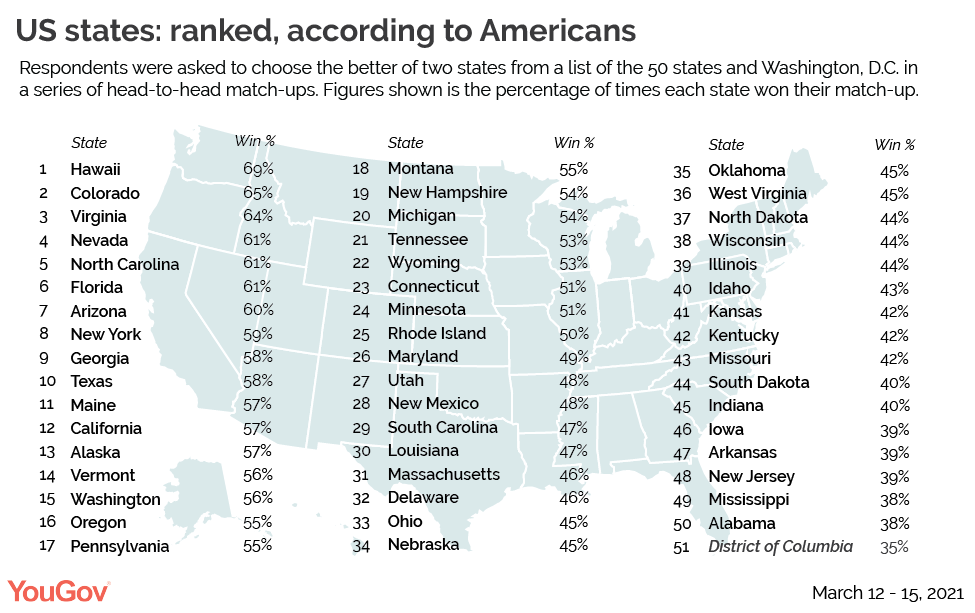
We asked people to choose the better of two states in a series of head-to-head matchups. States are rated based on their “win percentage”, that is: how often that state won the head-to-head matchup when it was one of the two states shown.
All 50 states were shown, in addition to Washington, D.C., but territories were not included.
Hawaii, which is well-known for its beautiful beaches and warm weather, took the top spot by winning 69% of its matchups. With its scenic mountains, hiking paths, and recreational marijuana industry, Colorado took second place with 65% of matches won.

The third-ranking state was Virginia (64%), a destination for American history and ocean coastlines. Nevada, the home of Las Vegas, landed in the fourth-favorite spot (61%), with North Carolina only marginally behind it (61%).
Following the top five, Florida snagged the sixth spot with a 61% win-rate. Another retirement destination, Arizona, won 60% of its matchups to take seventh. New York — the destination for Broadway, quality food, and the city’s culture — landed in eighth place (59%). Two other destinations for warm weather and ocean coastlines landed in ninth and tenth place, respectively: Georgia (58%) and Texas (58%).
America’s least popular states
The two lowest-rated states were Alabama (38%) and Mississippi (38%), which often rank low in other assessments of income and health care access. Both are Southern states, and in fact almost all the bottom ten states are situated in either the South, with Arkansas (39%) and Kentucky (42%) joining Alabama and Mississippi close to the bottom, or Midwest, including Iowa (39%), Indiana (40%), South Dakota (40%), Missouri (42%), and Kansas (42%).
The only exception is New Jersey, which comes third from bottom at 39%. While panelists did not provide context for their choices, New Jersey is often the butt of jokes, including for its occasional odor or for being the birthplace of The Jersey Shore franchise.
Washington, D.C., which was also included in the survey, scores worst of all, winning only 35% of its matchups. Americans might be rejecting the political divisiveness it stands for—or could be protesting that it is, in fairness, not a state (despite efforts to change that).
Americans favor their home state or current residence
Prior to the survey, YouGov asked respondents, “Regardless of where you live now, which state do you consider yourself to be from?” and also “Regardless of where you are from, which state do you live in now?” Americans chose their home state 77% of the time it was shown, virtually the same as how often they selected their current state of residence (79%).
About one-third of Americans report currently living in a state other than their home state. These people selected their home state 70% of the time, with people living in their home state say it is better in 81% of matchups.
You can find your state by searching or scrolling though the complete list of results below.
For more information, reach out to uspress@yougov.com
Related: America’s best and worst states, according to Democrats and Republicans
Methodology: 1,211 US adults were asked to choose the better of two states from a list of the 50 US states and Washington, D.C. in a series of head to head match-ups. The poll’s introductory text stated, “On each of the next few pages, you will see the names of two states in the US. On each page, we would like you to select the state that you think is the better state. You will see 7 different match-ups between states.” On each page, they saw two states with the prompt: “Which of the following states is better?” Each respondent saw seven match-ups, and no respondent saw a state twice. Data was weighted to be nationally representative of all US Adults, 18+. The survey was conducted between March 12 – 15, 2021.
Image: Photo by Jess Vide from Pexels
Join Our Telegram Group : Salvation & Prosperity


